 PoshanSense
Healthy ageing is a whole playlist, not one superfood.
A 2025 study tracked dietary patterns and healthy ageing. The useful story is variety, with observational limits kept in view.
Underlying paper: Nature Medicine · Published
A study result is a clue to understand, not a promise for your body.
The internet would love to nominate one food as the secret to ageing well. A berry would make a photogenic candidate. A 2025 paper asked a broader question: how do patterns of eating relate to reaching later life with several kinds of health intact? It is a more interesting story than a shopping list with one celebrity ingredient. It also needs a careful verb: associated.
The paper in a small bite
Published on 24 March 2025, this analysis used 1986–2016 data from 105,015 US participants. Healthy ageing meant reaching 70 without major chronic disease, with cognitive, physical and mental health intact. Higher adherence to eight dietary patterns was associated with better odds; the strongest highest-versus-lowest fifth comparison had odds ratio 1.86 (95% CI 1.71–2.01). This was not a randomized diet intervention.
Healthy ageing was more than birthdays
The caveats travel with the finding
Participants were predominantly US health professionals; diet and some outcomes relied on questionnaires. Residual confounding remains possible. Cohorts had NIH support and authors had additional research grants; one author disclosed an International Nut Council-funded grant. Fresh publication does not mean freshly collected data. The finding cannot predict your individual ageing or establish one ideal Indian diet.
Why patterns make the question more useful
A meal is not a collection of isolated headlines. The things you eat regularly form a pattern, and one favourite ingredient does not describe it. Thinking in patterns lets you ask about the everyday spread without expecting a single food to compensate for everything else. It also leaves room for preferences, prices, family habits and availability.
Our example is a weekly menu notebook: perhaps fruit at breakfast, dal on several evenings and vegetables with a usual lunch. Those are illustrations of describing variety, not a reconstruction of the diets measured in the study. You cannot match a few meals to a research score and announce that the paper has calculated your future.
Odds are not percentage points
An odds ratio compares odds between groups. It is not the percentage of people who benefit, and it is not a number of years added to life. Translating it into either would require information and assumptions that a headline often omits. The size of a relative comparison needs the context of how the outcome was defined and how common it was.
There is another distinction: reaching a research threshold is not the same as feeling well in every aspect of daily life. The definition helps researchers organise a question. It should not become a verdict on a person, particularly someone living with disability or a chronic condition. Health research can be informative without ranking lives.
A practical interpretation for your food journal
Look for recurring meals you can describe accurately and repeat comfortably. If your record only says “lunch,” adding the main foods and rough amounts may make it more useful. If you eat a varied meal but only log one item, the record tells a smaller story than the plate. That is a recording problem worth solving before chasing a trendy ingredient.
This paper does not supply a calorie target, a list of compulsory imported foods or a reason to buy supplements. A culturally familiar routine can be discussed on its own terms with an appropriately qualified professional. The next research step is to test interventions and examine whether results hold in other populations. For now, keep the broader question: what does the ordinary pattern look like? The superfood audition can wait.
A question to keep for the next headline
Ask whether the everyday takeaway is something the researchers measured, or our interpretation of their result. Both can be useful, provided they are labelled clearly and kept within the evidence.
Sources & further reading
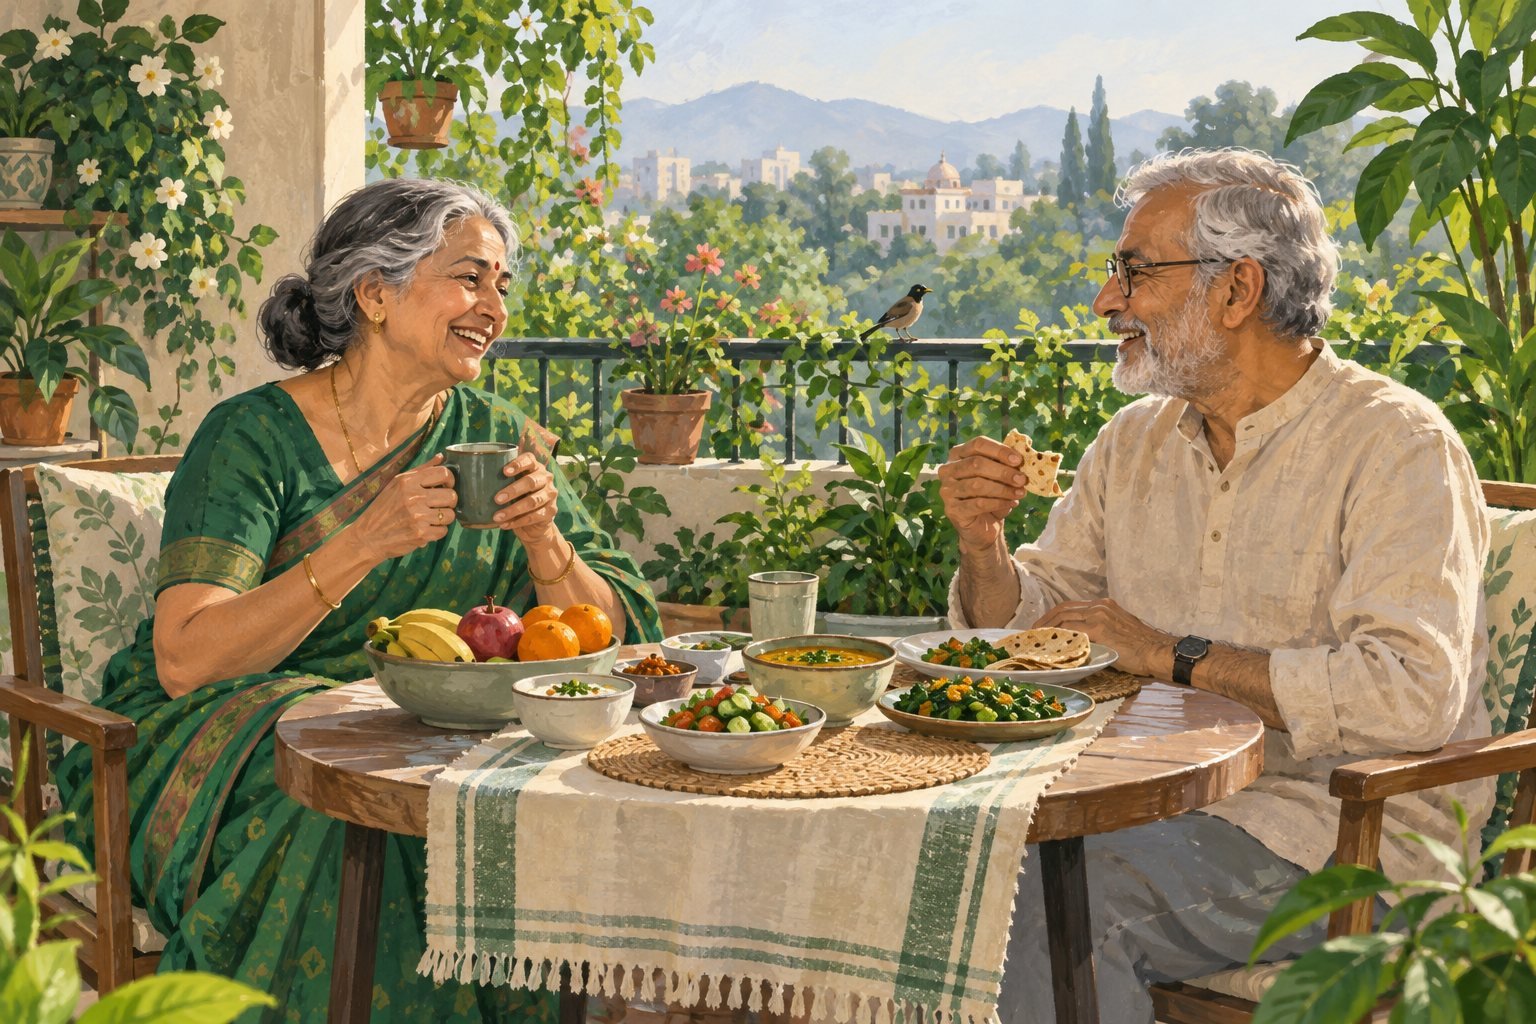
Cover art is AI-generated conceptual illustration, not actual study participants, menus or microscopy. Diagrams are original PoshanSense graphics. Paper figures and publisher images are not reproduced. Examples and practical interpretations are identified in the text.
Published 5 October 2026 · Sources checked 5 October 2026. Suggest a correction.