 PoshanSense
Whole grains and blood pressure: read the evidence, not the brown packaging.
A 2025 review links whole-grain intake with lower hypertension risk, while leaving causality and exact portions uncertain.
Underlying paper: Scientific Reports · Published
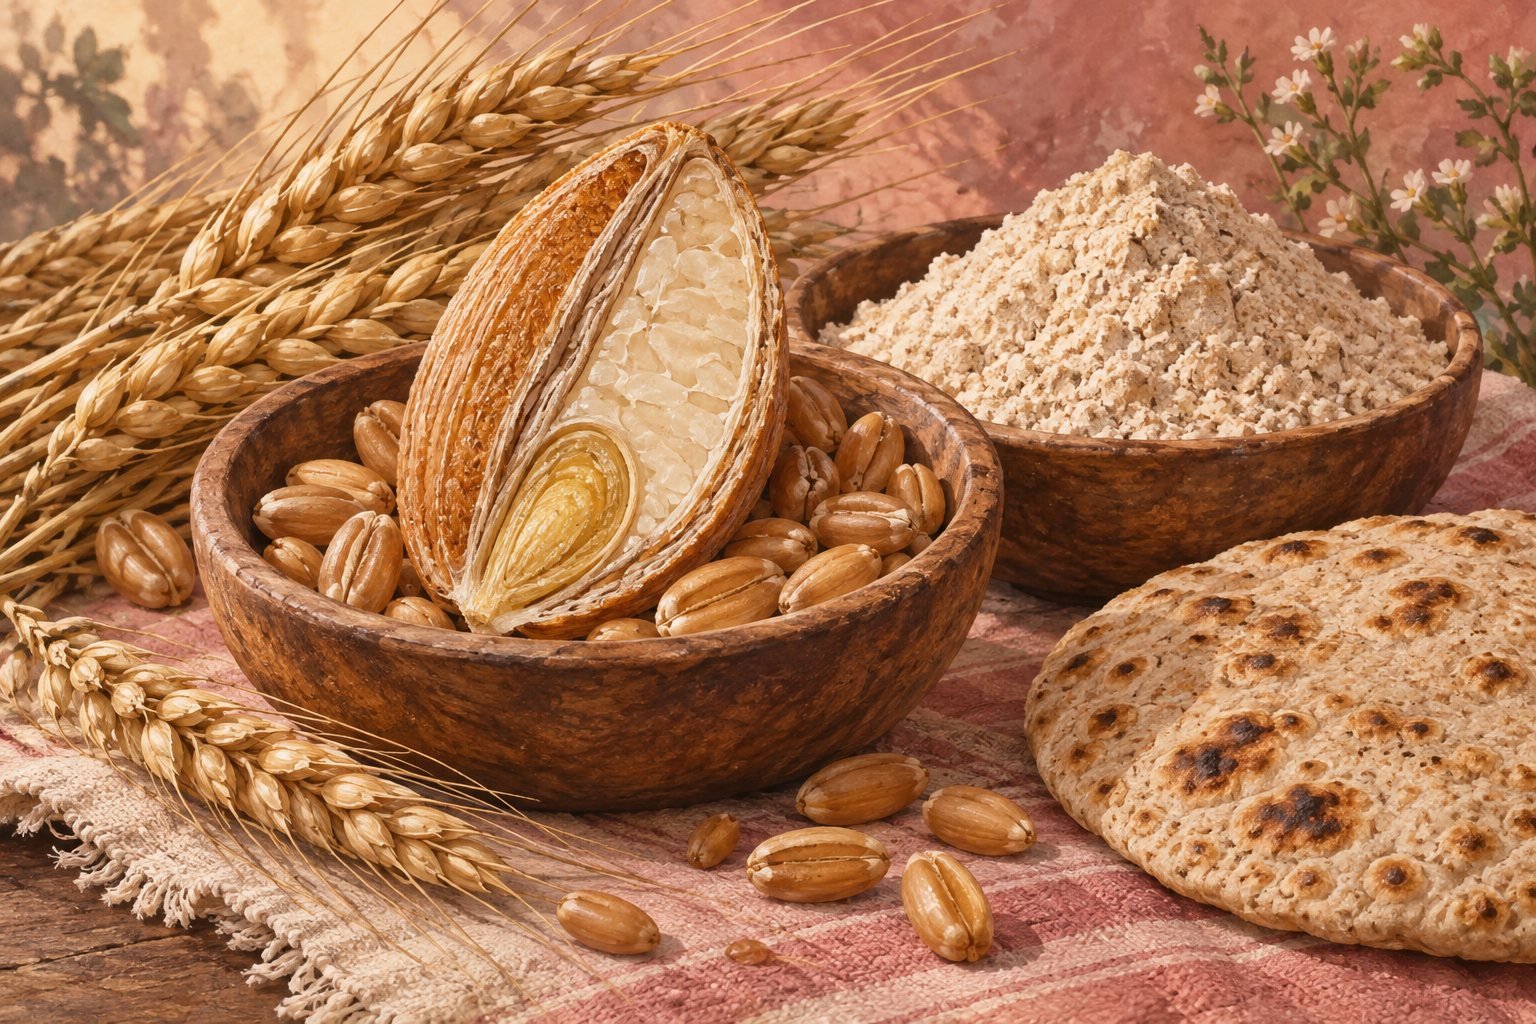
A study result is a clue to understand, not a promise for your body.
Brown packaging has become remarkably good at looking wholesome. A grain does not become evidence because the packet uses earthy colours. A 2025 review asked about whole-grain consumption and developing hypertension, using long-term observational studies. The result is worth understanding, along with two quieter details: the studies differed substantially, and a pooled association is not a personal treatment plan.
The review in plain language
Published on 1 July 2025, the review included nine prospective cohorts. Higher versus lower whole-grain intake was associated with lower hypertension risk: relative risk 0.74 (95% CI 0.59–0.93). Heterogeneity was very high (I² 97%). Refined grains showed no clear association. The database search ended in July 2024; this review did not run a new diet experiment.
Three checks before borrowing the number
The important limits
Food questionnaires can be inaccurate, and healthier habits can confound grain associations. Serving definitions and populations differed. The authors reported no competing interests. The paper does not establish that a particular roti or millet recipe reduces blood pressure, and the uncertain refined-grain result does not establish universal safety. Do not substitute an ingredient change for prescribed care.
Why nine studies are not automatically one answer
Combining studies can reveal a broader pattern. It can also gather different definitions, intake ranges and methods into the same estimate. Heterogeneity tells us to examine those differences rather than imagining one identical result repeated nine times. A useful review gives a summary and enough detail to understand where that summary is unstable.
Picture comparing travel times across cities. Even if every route goes in the same direction, the distances and conditions can differ. An average may be informative, but it does not become the expected travel time for your street. The analogy explains why variation matters; it is not a statistical model of food or blood pressure.
Keep the outcome and the unit straight
Developing hypertension over follow-up and changing a blood-pressure reading are related but different outcomes. A relative-risk estimate does not tell you how many units a reading will fall. It also does not tell everyone to eat the same number of grams. Reading the unit alongside the headline is a small habit with a large effect on how accurately you understand the claim.
Food weights can introduce another confusion. A cooked bowl, a dry ingredient quantity and a stated serving are not interchangeable descriptions. In your journal, specify which amount you mean when you can. The research review cannot resolve the weight of your own bowl or turn a recipe name into a measured portion.
What to do with the story at the table
Our practical example is simply better description: note the flour or grain used in a familiar meal, its approximate amount and how it was prepared. If you are comparing products, look at their actual ingredient information rather than judging the artwork. Those are recording and reading suggestions, not a diet intervention derived from the review.
The next scientific questions include stronger intervention evidence and clearer comparisons across populations and grain definitions. For readers, the useful takeaway is that the association is interesting and its limits remain visible. If you have hypertension, follow your individual care plan and discuss dietary changes with an appropriate professional. A grain can be part of dinner without having to audition as your blood-pressure medication. The packet’s colour is still just a colour.
A question to keep for the next headline
Is the headline discussing hypertension risk, a change in a reading or a food label? Keep the outcome attached to the evidence before borrowing its number for another question.
Sources & further reading
Cover art is AI-generated conceptual illustration, not actual study participants, menus or microscopy. Diagrams are original PoshanSense graphics. Paper figures and publisher images are not reproduced. Examples and practical interpretations are identified in the text.
Published 5 October 2026 · Sources checked 5 October 2026. Suggest a correction.